Originally published : Thu, March 10, 2016 @ 3:21 PM
Updated : Wed, August 16, 2017 @ 9:15 AM
Here is the final installment of our “Imaging Stellaris Assays” blog series. In our two previous posts, we’ve gone over microscope hardware and image acquisition. In this article, we will walk you through some simple downstream image processing that will turn your raw Z-stack images into spectacular-looking, publication-ready images.
Step-by-Step Overview:
- Opening your Raw Image Files
- Pre-processing Checks
- Creating a Maximum Intensity Projection
- Generating a Composite Image
- Adjusting Brightness and Contrast
- Adding a Scale Bar
- Saving your Final Image
Let’s Get Started
We will be using the “Fiji Is Just ImageJ” (Fiji) image processing package, which is an open source free distribution package of ImageJ. Fiji expands on the standalone ImageJ program to include many useful functions and plugins contributed by the community downloadable at http://fiji.sc/Downloads. The steps in this article should also be compatible with most other image processing software.
For an in depth introduction to ImageJ and Fiji, please read the Getting Started page (http://fiji.sc/Getting_started). There are also additional resources on how to use ImageJ on the ImageJ Tutorials page (http://fiji.sc/Category:Tutorials).
Opening your Raw Image Files
After starting up ImageJ, you can easily open your raw image files by dragging the file into the ImageJ window. Begin by dragging the 60x Z-stack file of the cellular proliferation biomarker MKI67 in MCF7 cells we took in the last blog article into the ImageJ window. If you haven’t read our previous blog article, or forgot how to create the 60X image stack, click here for a refresher. After dragging the file into Fiji, you may see the Bio-Formats Import Options window appear.
Note: Some file types do not require the Bio-Formats Importer. If the Bio-Formats Importer window doesn’t open, don’t worry. Skip the Bio-Formats instructions and jump to the Pre-processing checks section.
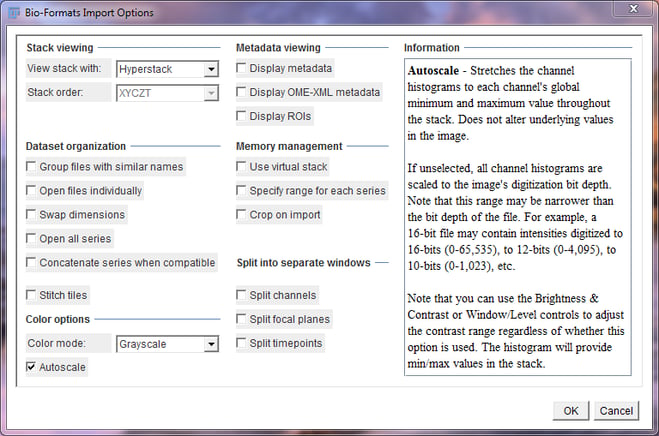
Bio-Formats Import Options Window
Be sure to select Hyperstack in the “View stack with” drop down and Grayscale in the “Color mode” drop down menu. Check the “Autoscale” check box to make viewing images easier. Press “OK” to continue.
Depending on your computer’s processing speed, it may take a few seconds for the file to open. ImageJ is loading your image into its working memory, which can take a while for larger images.
Tip: If your computer is frequently taking a long time to open these files, you may want to consider checking the “Use virtual stack” checkbox especially if you just want to quickly check a few individual images in your Z-stack. ImageJ will only load one slice of your image at a time, significantly speeding up the opening of the image file. The only downside is switching between slices takes much longer.
Pre-processing checks
Once your image is open you can use the scroll wheel or the left and right arrow keys to move through the Z-stack. You can see your position in the Z-stack in the top left corner or with the bar on the bottom.
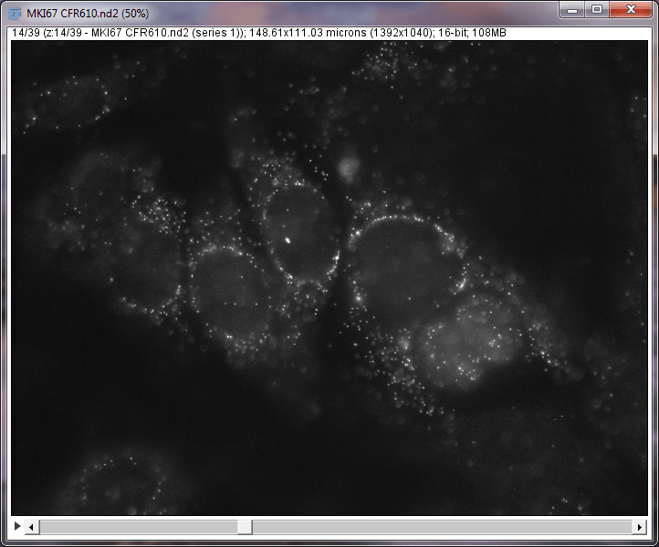
Single z-slice illustrating single molecules of RNA from the cellular proliferation biomarker MKI67 in MCF7 cells
It is good practice at this point to briefly scroll through your Z-stack to look for any errors such as missing ends of cells, false(artifactual) signal, significant drift in the XY plane, or free floating autofluorescent particles. These objects or errors can end up in your final picture after processing and should be accounted for in the final analysis. We will cover how to work with these errors in a future article.
Tip: If you don’t see anything in your Z-Stack, your display ranges might not be set correctly. Press Shift + C to open the Brightness and Contrast window. Click on “Auto” to automatically adjust your image to the correct display values. The “Auto” button will adjust to the current slice, so it’s usually a good idea to scroll to the middle of the Z-stack where there is signal. Manual adjustment may be required.
Creating a Maximum Intensity Projection
After you’ve checked out the stack, we can go ahead and create a Maximum Intensity Projection (MaxIP) of our Z-stack. A MaxIP is a rendering method that compresses a 3D Z-stack into a 2D image. Each XY position in the resulting image is the brightest pixel of the entire stack. This is great for Stellaris images since signal molecules should be the brightest spots in the stack.
To do this, we are going to use the built-in Z Project tool. To get there, click on “Image” > “Stacks” > “Z Project…”
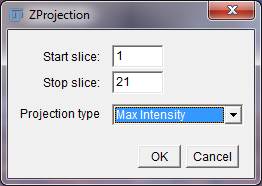
Z Projection Options Window
The Start and Stop slice boxes should be set to the maximum and minimum slice numbers by default. Set the “Projection type” to “Max Intensity” and click “OK.”
Tip: If there are many extra slices on either end of your stack, you may want to consider changing the start and/or stop slice numbers to truncate the MaxIP to the correct area.
Congratulations! You just created your first MaxIP! We are one step closer to producing a publication quality image.
Next, we should open up the DAPI Z-Stack that we took previously. Follow the same steps as above to open an image and create a MaxIP of the DAPI Z-Stack. Be sure to click on the newly-opened DAPI window so that ImageJ knows on which window to perform the MaxIP.
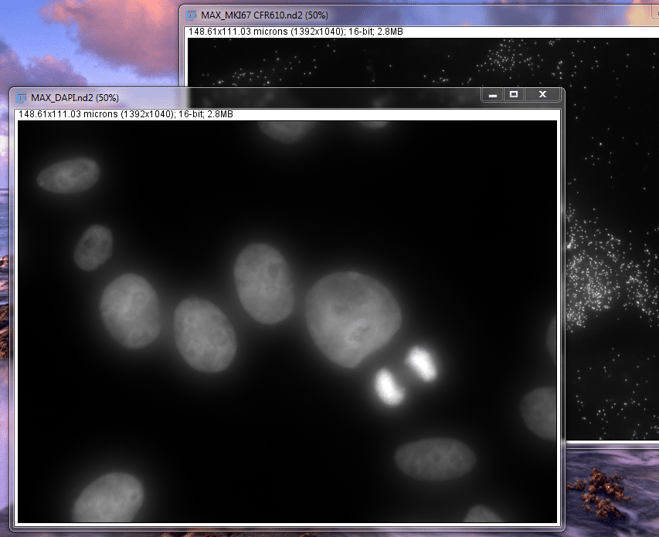
MaxIP of DAPI and MKI67 in MCF7 cells
Generating a Composite Image
Once we have both MaxIP images open, we’re going to generate a composite image combining the two. We will be pseudocoloring the DAPI channel blue to help distinguish the nuclear stain from the Stellaris signal. To do this, in the menu, we are going to click on “Image” > “Color” > “Merge Channels…” You will be prompted with the window below.
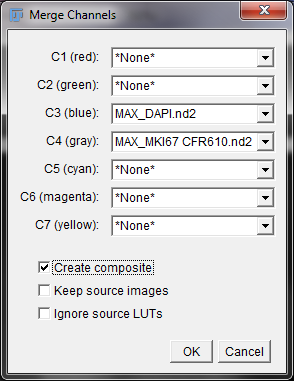
Merge Channels Options Window
In the drop down menu for C3 (blue) select the title of your DAPI image. Then for C4 (gray), select the title of your Stellaris image and press “OK”. The titles of the MaxIP images should start with “MAX_”. This will create a composite image where the DAPI channel looks blue and your Stellaris signal looks white/gray. You can use any color combination that you would like, but we prefer the blue and white look when working with only one Stellaris Probe Set. After clicking “OK” you should have an image the looks like the one below.
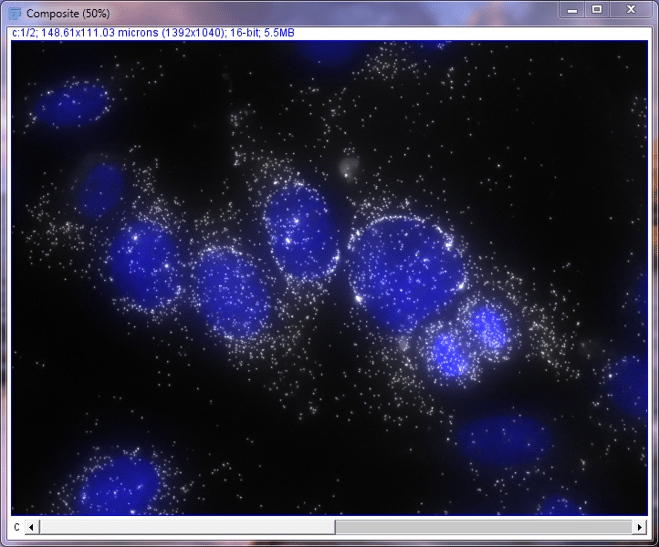
Composite image of DAPI and MKI67 in MCF7 cells
While this image may already look great, most images are going to need additional brightness and contrast adjustments to be publication-ready. Now we’re going to perform some basic adjustments.
Please note that the scroll bar on the bottom of the image has returned, but in a different form. While the scroll wheel in the Z-stack allowed us to scroll through the Z-plane, this scroll wheel allows us to select one color in our composite image. This allows us to make changes to one of the original images without affecting the other.
You can switch between these images using the left and right arrow keys or the scroll wheel, just like with the Z-stack we had earlier. Also note, that when you switch between images, the color of the border and header text changes color. Blue is the blue channel (DAPI) and black is the gray channel (MKI67). We are going to use this to independently change the brightness and contrast of the DAPI and MKI67 images.
Adjusting Brightness and Contrast
Press Shift + C to open the Brightness and Contrast window.
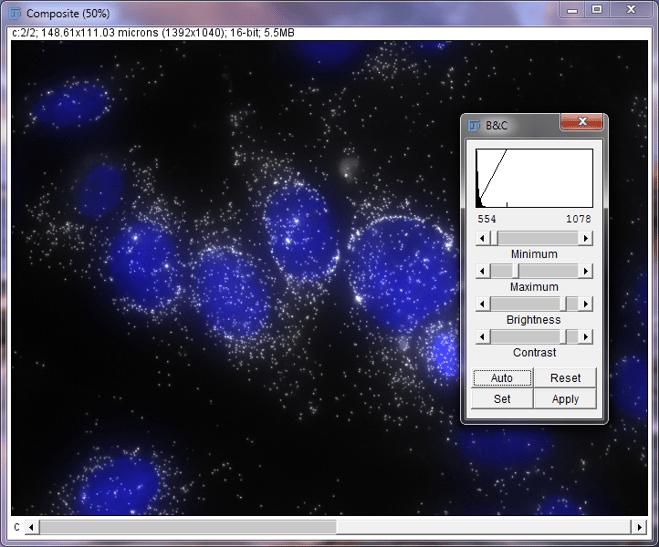
Composite image of DAPI and MKI67 in MCF7 cells with Brightness and Contrast Window
The brightness and contrast window has three main parts: histogram, brightness sliders, and other function buttons.
The histogram is a bar graph showing how many pixels are in the image and is sorted by brightness. The left represents darker pixel values and the right represents brighter pixel values. While not both visible in this screenshot, there are two vertical tick marks along the bottom of the screen that represent the minimum and maximum values in the display image. Those values are also written just below the histogram
The brightness sliders control how the image is displayed. By sliding the minimum and maximum bar, you control what pixel value will be displayed as black and what value will be considered white. Values in between the min and max values will be proportional shades of gray. The brightness slider will move both the minimum and maximum values to the left or right together, while the contrast slider will move the min and max values further apart or closer together. We will be using the Minimum and Maximum sliders to adjust this image.
Use the scroll wheel or arrow keys to select the MKI67 portion of the image. The header text, border, and histogram should be black.
First, we want to make sure the darkest part of the image looks black on our monitor. The darkest part of most images should be the space between cells. Since this area appears black on our monitor, there is no need to adjust the minimum value. If in your image the space between cells appears gray, slide and drag the minimum slider up (to the right) until it looks black.
Next, we want to make sure that the signal in the image appears bright and clear. The signal in this image looks too bright and appears like it is glowing. We will increase the maximum value by sliding the bar to the right to darken the signal in this image. If you cannot see any signal in your image, try sliding the maximum bar to the left to increase the brightness of your signal.
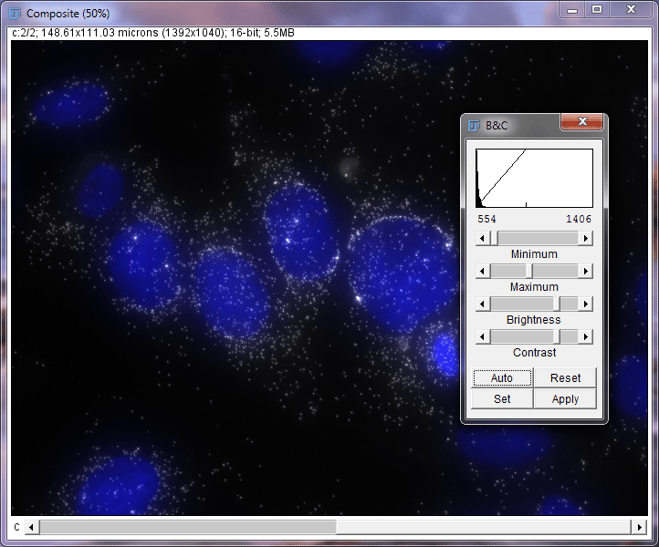
Composite image of DAPI and MKI67 in MCF7 cells with Brightness and Contrast Window, Post-MKI67 Adjustment
Now, use the scroll wheel or arrow keys to switch to the DAPI image. Be sure to click on the Composite window to do this or you will be altering the brightness and contrast settings. The header text, border, and histogram color should change to blue. Switch back to the Brightness and Contrast window. We will adjust the DAPI channel the same way we did with the MKI67 image. Most of the time, DAPI images will look like the nuclei is glowing. We will increase the minimum value to reduce the glow.
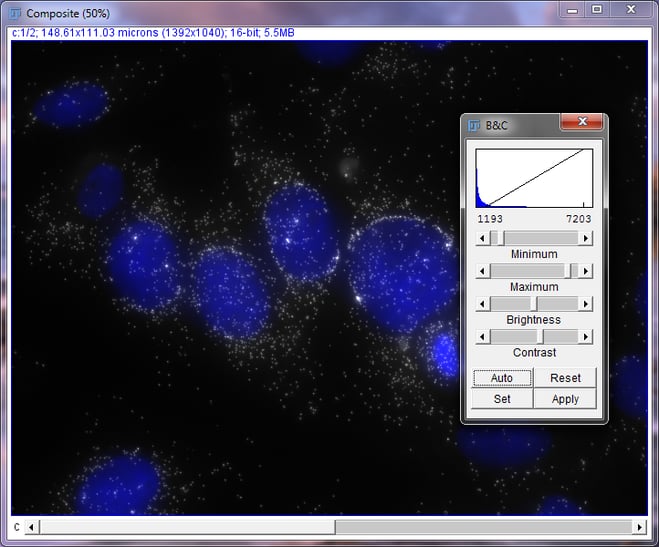
Composite image of DAPI and MKI67 in MCF7 cells with Brightness and Contrast Window, Post-DAPI Adjustment
Alternatively, if you would prefer to automatically adjust the display values, we recommend that you use the “Enhance Contrast” tool. It is a simple-to-use tool that produces well adjusted images. You can find the Enhance Contrast tool under the “Process” menu. Set your Saturated Pixels value to somewhere between 0 and 5. For a Stellaris image, a saturated pixel value between 0 and 1 works well for most images. Make sure “Normalize” and “Equalize Histogram” are unchecked.
Adding a Scale Bar
To add a scale bar, we are going to use the built in Scale Bar tool. Click on “Analyze” > “Tools” > “Scale Bar”. You should be prompted with the window below.
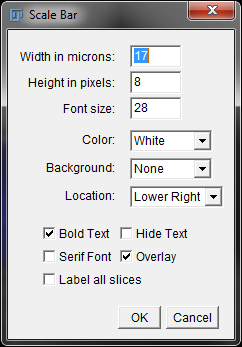
Scale Bar Options Window
Set your width in microns to the appropriate number. ImageJ picks a default number based on scaling of the image and the size. In this case, we are going to change the width to 10 microns. We are going to leave the rest of the settings as default. Your image may need some adjustments to background or location if needed. Click “OK” to confirm your scale bar settings.
Tip: If you closed the scale bar options window but need to make changes to the scale bar, you can easily do so by re-opening the scale bar options window and making changes there. This only works when Overlay is checked.
Saving your Final Image
After adjusting your image to your liking, you are now ready to save your image. We recommend saving your file in two formats: raw 16-bit Tiff and 8-bit PNG. Tiff is an image format that will preserve individual pixel values and retain the ability to independently change brightness and contrast in the future.
Open the “File” menu and mouse over “Save As”. Select “Tiff”. Specify the location and filename to save. The image we used is already in the 16-bit file format, so there is nothing to change. If your image is not a 16-bit image, do not change your image to the 16-bit format.
We will then save our image as an 8-bit PNG. 8-bit images are easily viewable by most computers and the PNG file format is a much easier file to view and share with others. We will first change the image to an 8-bit image by going to “Image” > “Type” > “8-bit”. Then we will save our file as a PNG by going to “File” > “Save As” > “PNG”. Select your desired file location, type your file name and click “Save”.
Final words…
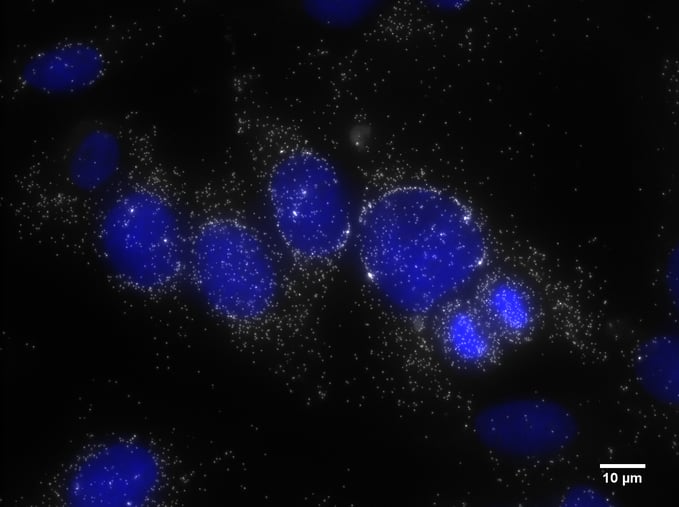
Final Composite Image of DAPI and MKI67 with Scale Bar
You should now be more familiar with the basics of producing publication-ready images from your raw image files. In this complete blog series, we introduced the fundamentals of microscopy where we hope you can confidently verify that
- Your microscope has been properly set up
- You have successfully imaged your sample
- You have processed your raw image files into images ready for publication.
We sincerely hope you found the Imaging Stellaris Assays series useful. If you have any tips or suggestions of your own, feel free to comment.
Already have a spectacular image you’d like to share? Submit it to our image gallery. Otherwise, visit our gallery to browse through some rather amazing Stellaris images.
Other articles in the series:
Imaging Stellaris Assays Part I: Get to Know Your Microscope
Imaging Stellaris Assays Part II: How to Acquire Stunning Images

