Updated : Fri, October 21, 2022 @ 10:24 AM
Fluorophores are molecules that can absorb light energy in a process called excitation and re-emit light energy at a longer wavelength in a process called emission. As the absorbed and emitted light are detectable as different colours on the visible spectrum, this makes fluorophores ideal for use in a variety of assays to help determine the concentration of target analyte in a sample.
In qPCR, fluorescent modified oligos may be either linear or non-linear in structure. In either conformation, Förster resonance energy transfer (FRET) combined with the static quenching mechanism inhibits reporter dye emission until hybridisation with the target (read Quenching Mechanisms in Probes to learn more about FRET and static quenching). Upon hybridisation the quencher and reporter dye are separated spatially, interrupting the quenching mechanisms and permitting fluorescence emission from the reporter dye. The increase in signal intensity with repeated PCR cycles indicates the accumulation of product and allows for accurate quantification of template. Gene expression analysis by qPCR is dependent upon direct comparisons between the normalised fluorescence emission of individual samples against a standard curve or through ‘relative’ comparison against expression of an internal calibrator gene.
How do I know how bright the dye will be?
- Absolute Intensity – The absolute intensity of a fluorophore is directly proportional to the product of its extinction coefficient and quantum yield. However, the principal determinants of fluorescence detection are the instrument optics and the reaction conditions.
- Excitation sources – for qPCR include: argon lasers which excite at 488 nm and 545 nm; lamps, (halogen or xenon) that emit between 350 nm and 700 nm but at a lower intensity than lasers; or light-emitting diodes (LED) which provide a narrow bandwidth of light but at various wavelengths depending on the LED.
- Dye excitation – or the amount of light a dye can absorb, is directly dependent upon the excitation source and whether it aligns to the dye absorption spectrum. If the excitation source emits at wavelengths far removed from the maximal absorption wavelength (λmax) of the dye, then the extinction coefficient will be some fraction of its maximum and dye intensity will not reach full potential. Be certain that the excitation source uses a wavelength appropriate to excite the dye you have selected.
- Molar extinction coefficient – is the measure of a dye’s light absorption at a particular wavelength and is significant in determining how much incident light will be converted to fluorescence emission. Many common fluorophores have extinction coefficients at their wavelength of maximal absorption between 5,000 and 200,000 mol-1*cm-1. Extinction coefficients may be determined at any place on the absorption spectrum by calculating what fraction of the maximum absorption is occurring at the new wavelength. This is done using normalised absorption spectrum such that the value at the λmax is set to 1. The calculated fraction is then multiplied by the extinction coefficient at the λmax to give the anticipated extinction coefficient at the new excitation wavelength.
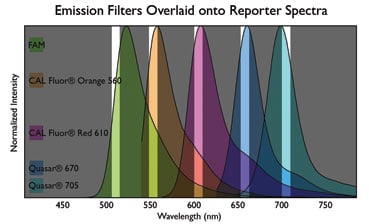
- Excitation and emission filters – are carefully engineered to selectively detect the desired dye to the exclusion of adjacent fluorophores. With most organic fluorophores, the maximal emission wavelength is typically around 20 nm from the λmax. The diagram below is a representation demonstrating that qPCR machines have a limited range through which each filter collects fluorescence. It is essential that the reporter dye be aligned with one filter set of the machine.
- Multiplexing – is the simultaneous assay of multiple gene targets, with each gene-specific probe labelled with a different fluorophore. The deconvolution of independent signals may be complicated by fluorescent bleed-through between adjacent channels, or cross-talk. If unanticipated, crosstalk can produce false positive amplifications and impair quantification. The instrument anticipates a certain level of cross-talk based on the dye calibration settings in the software. To avoid cross-talk, select dyes with emission far removed from one another. It may be necessary to calibrate the machine for the emission of the particular dye to be used in the multiplex assay. Some cross-talk is unavoidable.
- Quantum Yield - The inherent flexibility of the dye structure will play a role in the dye quantum yield. Very flexible dye molecules will have lower quantum yields, particularly at higher temperatures, while very rigid dye molecules will have higher quantum yields. Quantum yield may also be dependent on oligonucleotide length, sequence composition, salt concentration and buffer formulation. These dependencies vary from one dye to the next. With FAM-labelled oligos in particular, intensity decreases with increasing temperature or decreasing pH.
Assay performance is different from dye performance. When considering the variables affecting assay performance and its diagnosis when things go amiss, the failure may not necessarily relate to the dye or even the probe but rather other elements in the ensemble, such as primers, enzymes or inhibitors that were unanticipated. If you are looking for ways to troubleshoot unexpected results from your qPCR assays, you may like to read this article: 8 qPCR amplification plot questions answered.
Finally, have a look at another one of our articles that offers guidance with interpreting your qPCR amplification curves and diagnosing assay problems.
References
Handbook of Fluorescence Spectroscopy and Imaging (John Wiley & Sons 2010)
