Updated : Thu, February 3, 2022 @ 6:10 PM
When results from your qPCR assays aren’t quite what you expected, it can be challenging to understand what went wrong. From pipetting errors to incorrect instrument calibration, many variables can cause unanticipated outcomes. If you’re having trouble making sense of your qPCR amplification plots, the information below may help get you back on track.
-
Why might jagged amplification signals indicate probe problems?
A jagged signal in an amplification plot is typically the result of poor probe signalling, which causes the instrument software to magnify the baseline noise to compensate for the low signal.
There are several potential causes for low signal. Check these three factors first:-
Concentration of the probe: low signal could be a sign that the concentration of your probe is too low.
-
Melting temperature of the probe: When the Tm of the probe is low, probe binding is inefficient under standard PCR conditions. When the Tm of the probe is close to that of the primers, probe hydrolysis may be compromised.
-
Probe length: If the distance between the fluorophore and the quencher dye is too far, then inefficient quenching, elevated background fluorescence and lower signal per cycle is expected.
Fluorophore selection is another significant factor. Some pairings of fluorophores and quencher dyes form intramolecular dimers, resulting in a pseudo-beacon structure that is very efficiently quenched. In a robust assay, switching dyes is usually seamless, with only a slight change in quantification cycle (Cq
) value. Such variation is typically in the order of one to two cycles, and relates to the differences in dye intensity and the variation in instrument optics across the different channels. Fundamentally, all real-time thermal cyclers are engineered to detect fluorescein (FAM) most effectively. For some instruments, dyes with longer wavelength emission may be detected less sensitively.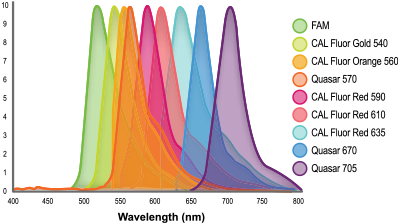 Figure 1. LGC, Biosearch Technologies' wide array of fluorophores spanning the spectrum.
Visualise fluorophore and quencher dye combinations according to your PCR instrument with our Spectral Overlay Tool.

-
-
What may cause variable results for a replicated sample within an assay?
False positives or negatives may result from several factors:
-
A false positive can be recorded if contamination occurred during the PCR setup. This would be evident if negative controls were also returning a positive result. In this case, the source of the contamination needs to be addressed. Be sure to change pipette tips after each use to prevent cross-contamination between samples. Cleaning the reaction setup area and pipettes with a 10% bleach solution is an effective way to remove any potential contaminants. Ensure that pre-PCR and post-PCR processes are physically separated.
-
False negatives may result from a component missing from the reaction. In many cases, this could mean that no template was added to the sample well or that the sample concentration is too low. However, if the master mix is not appropriately mixed, a reaction component (primer, probe, etc.) could be missing from that sample. Therefore, for the most consistent and accurate results, thoroughly mix and briefly centrifuge all solutions before pipetting.
-
-
What causes qPCR inconsistencies in control template dilutions for qPCR?
One source of trouble can be the preparation of the dilutions. A drop-out effect can be observed when performing dilutions with limited content of target DNA. It could be that the template did not make it into the reaction at specified concentrations because DNA may have been absorbed into the plastic surface. Plastics are porous surfaces and are well known to absorb some portion of their contents, including proteins, DNA or other biomolecules.
When manipulating only one or a few molecules of the target sequence, the drop-out becomes much more apparent. We recommend performing all dilutions with a buffer containing nucleic acid unrelated to the target for that situation. Frequently used carriers include yeast tRNA, PolyA, PolyC and linearised acrylamide. This carrier molecule is used in vast excess, e.g. 100 ng/uL, and preconditions the plastic so that the target molecules are less likely to become absorbed.
When using plasmid DNA as a template, amplification is aided by ensuring that supercoiled preparations are nicked or linearised before use.
-
What should the relative fluorescence units (RFU) threshold setting be for my qPCR assay?
For qPCR, only the end-users can determine their own experimentally derived threshold setting so they can discriminate between true low-level RFU and signal noise. Ensure the qPCR instrument is calibrated for the dyes being used and check the manufacturer's specifications for their recommended peak height minimum RFU. Judge anything below these levels very cautiously.
Get more information on calibration and our calibration dyes.
-
Is it best to manually select the threshold value or to let the qPCR software set it?
It is essential to set the threshold correctly so that the relative cycles between samples remain constant. The qPCR software may initially select an incorrect baseline setting. These baseline fluorescent values are used for threshold setting and so could result in a suboptimal threshold. The threshold should lie above the background noise, evident as the baseline, and within the phase of exponential amplification.
If the threshold is set incorrectly, Cq values would be affected for all assays and may result in lack of detection of samples with lower amounts of template or differences between Cq values between different samples and controls, thus affecting relative quantification.
-
What do amplification curves look like when probes are degrading during the qPCR reaction?
DNAse contamination (for example, due to bacterial contamination of reagents) or reducing agents carried over into the reaction result in progressively increasing baseline fluorescence. Trace amounts of microbial contamination in reagents can be enough to introduce the DNAse. A microbial cell that makes it into the reaction would be lysed at the high temperature for PCR, releasing DNAse, which degrades the probe and releases the fluorophore from the quencher.
Reducing agents such as DTT are sometimes present in master mixes and reverse transcription reagents (and different batches of polymerase will have different levels of DTT). This can be carried over from reverse transcription reactions, causing reaction degradation. All dark quenchers contain an azo bond (N=N) that represents a site of potential reduction. Once the azo bond is reduced, the quencher becomes non-functional.
-
How can removing DTT from the reverse transcription step help with baseline drift?
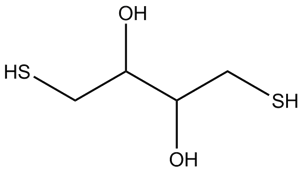
Dithiothreitol (DTT is a strong reducing agent capable of reducing the azo linkages present in BHQ™ (Black Hole Quencher™) dyes. Reduction of the azo bond in the BHQ dye results in a loss of quencher activity. Loss of quenching appears as increasing fluorescence and the background is then observed to increase, evident as baseline drift.
-
Could inhibitors in a sample cause unexpected standard curve slope values?
Inhibitors in the PCR reaction may cause the efficiency to change. These inhibitors may be carryover contaminants from the RNA or DNA isolation steps. To determine if an inhibitor is present in the template, a careful review of the Cq values of a serial dilution will reveal differences in delta Cq. For a sample without inhibitors present, the delta Cq should remain constant through the dilution series. When a sample does contain inhibitors, differences between Cq for the lower concentrations will be closer to expectation than for those at higher concentrations. When a sample that contains an inhibitor is diluted, the inhibitor is also diluted, therefore the inhibition is evident in high concentrations but less apparent at low concentrations. Diluting away the contaminant is not always an option, and in these situations, an ethanol precipitation or other DNA purification method may be beneficial.
 |
Is contamination impacting the quality and reliability of your qPCR assay? The COVID-19 pandemic underscored the various sources of contamination for RT-qPCR assays. Diagnose the cause of your unexpected results in this white paper.
|

Many variables need to be considered for adequate qPCR troubleshooting. If you’d like us to explore additional questions in this blog, please leave a comment below.
