Updated : Thu, May 11, 2023 @ 10:06 AM
If you run quantitative real-time PCR (qPCR) assays, the chances are that you’ve seen some strange looking amplification plots. When something looks off, it’s a red flag to start digging into potential causes and possible corrective actions. The characteristics of the amplification plot can offer information for troubleshooting. Firstly, we will consider the features of a 'normal' qPCR amplification curve before highlighting some commonly observed variations that may require extra attention to ensure accurate results.
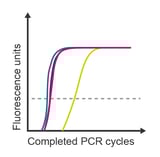
Does your amplification curve have these distinct phases?
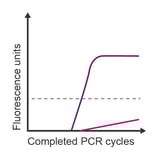
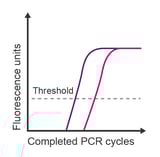
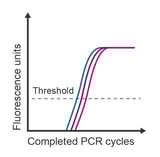
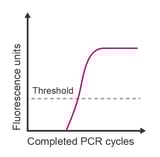
A standard qPCR amplification curve has three distinct phases: (1) a baseline that gradually transitions into (2) an exponential region, followed by (3) a plateau, which indicates that amplification is reducing. If your amplification curve is missing one of these phases, it’s time to start troubleshooting the possible causes.
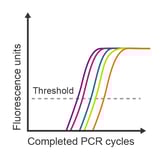
Quantitative real-time PCR (qPCR) is based upon the cycle number at which a replicating sample of target DNA accumulates sufficient fluorescence to cross a threshold. The threshold is either manually selected or auto-selected such that it lies significantly higher than baseline fluorescence (background noise) and below the plateau phase. Typically, the threshold is adjusted to the mid-point of the exponential phase of the reaction at a location suitable for all samples in the experiment. Ideally, this is within the range where the difference between cycles for different amplification plots remains constant. The Cq (quantification cycle) value for a given reaction is defined as the cycle number at which the fluorescence emission is significantly above the background.
Troubleshooting abnormal amplification plots
Here are some examples of observed variations from the standard amplification curve, along with potential causes and corrective steps.
 Observation: exponential amplification in the no template control (NTC)
Potential causes:
- Contamination from laboratory exposure to the same target sequence
- Contamination carried over from the reagent manufacture
Corrective steps:
- Clean the work area with 10% bleach and nuclease-free water
- Prepare the reaction mix in a clean lab, separated from any template sources
- Order new reagent stocks
- When using bacterial templates, ensure that reagents are guaranteed to be free of bacterial contamination
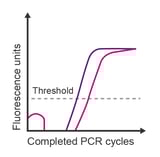 Observation: looping of data points during early cycles; high noise at the beginning of recorded data
Potential causes:
- Baseline adjustment is starting too early
- Too much template added to the reaction
Corrective steps:
- View the raw data, observing the amplification plots prior to baseline correction. Note the start and end of the linear section. Reset baseline to one cycle after the flat baseline begins and end two cycles before exponential increase is observed.
- Dilute input samples to within the linear range of the reaction.
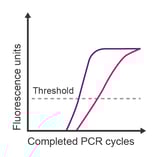 Observation: unusually shaped amplification; irreproducible data; later than expected Cq value
Potential causes:
- Poor efficiency during PCR reaction
- Difference in primer Tms is > 5 °C producing unequal extension
- Annealing temperature is too low
- Unanticipated variants within the target sequence
- Template material contains inhibitors
Corrective steps:
- Optimise primer concentrations and annealing temperature
- Redesign primers to a different region of the target sequence
- Aim for primer melting temperatures to be 2-5 °C of each other
- Keep the GC content of primers between 30-50%
- Test assay performance against carefully quantified controls
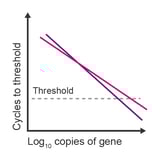
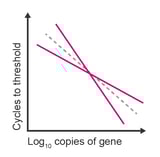 Observation: slope of standard curve is more or less than -3.34 and R2 value is less than 0.98
Potential causes:
- Inaccurate dilutions
- Standard curve exceeds the linear range of detection
- Data at extremes of the standard curve are variable
Corrective steps:
- Recalculate the standard concentration or gene copy number using a spectrophotometer or other means
- Make new stock solutions of the control standards
- Eliminate extreme concentrations
- Consider using a carrier such as a yeast tRNA in the buffer used to generate the dilution series
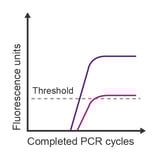 Observation: plateau is much lower than expected
Potential causes:
- Limiting reagents
- Degraded reagents (dNTPs or master mix)
- Some probe dyes are less bright than others
- Inefficient reaction
- Incorrect probe concentration
Corrective steps:
- Check calculations for master mix
- Repeat experiment using fresh stock solutions
- Compare end-point fluorescence to a different reaction using a probe labelled with the same dye
 Observation: unexpected data values
Potential causes:
- Samples incorrectly labelled
- Plate inserted backwards
- Poor primer specificity
- Inhibitors in sample
Corrective steps:
- Rerun samples or plate using extra caution when loading
- Redesign primers to increase specificity
- Run a dilution of samples (inhibitors will be diluted and may result in lower Cq for diluted material)
 Observation: Cq is much earlier than anticipated
Potential causes:
- Genomic DNA contamination of RNA
- Multiple products or multicopy gene
- High primer-dimer production (when using binding dye detection)
- Poor primer specificity
- Transcript naturally has high expression in samples of interest
Corrective steps:
- DNAse-treat before reverse transcription
- Redesign primers ensuring specificity
- Optimise primer concentration and annealing temperature
- Test assay performance against carefully quantified controls
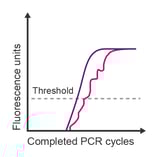 Observation: jagged signal throughout amplification plot
Potential causes:
- Poor amplification or weak probe signal
- Mechanical error
- Buffer-nucleotide instability
Corrective steps:
- Ensure a sufficient amount of probe is used so that background noise isn’t amplified
- Try a fresh batch of probe
- Mix primer/probe/master solution thoroughly during reaction set up
- Contact equipment technician
 Observation: technical replicates are variable and have a difference in Cq values > 0.5 cycles
Potential causes:
- Pipetting error
- Insufficient mixing of solutions
- Low expression of target transcript resulting in stochastic amplification
- Poorly optimised reaction
- High Cq/low concentrations of template
Corrective steps:
- Calibrate pipettes
- Use positive-displacement pipettes and filtered tips
- Mix all solutions thoroughly during preparation
- Hold pipette vertically when aspirating solutions (sterile technique does not ensure reproducibility when working with small volumes)
- Optimise reaction conditions
- If possible, add more sample to achieve lower Cq
 Observation: irreproducible comparisons between samples
Potential causes:
- Amplification efficiency is below 88% in one or both samples
- Differences in efficiency are >5%
- RNA degradation
- Inaccurate dilutions
- Low concentrations are being measured
Corrective steps:
- Redesign primers for one or both genes
- Repeat experiment with fresh reagents and sample
- Check samples with a target that is more highly expressed
 Observation: no data in selected wells
Potential causes:
- Wells were not selected for analysis
- Wrong dye selection for analysis
- Failed first-strand synthesis
- Failed PCR
- No expression of the target transcript
Corrective steps:
- Check settings for data collection and data viewing
- Determine whether background fluorescence can be seen
- Repeat experiment with new reagents
- Test assay performance against carefully quantified controls
- Check samples with an alternative target
 Observation: lower concentrations all overlap
Potential causes:
- Limited linear range of detection due to low expression of the target transcript
- Template contamination obscures the assay’s limit of sensitivity
- Detection of primer dimers (binding dies)
Corrective steps:
- Remove contamination
- Optimise assay conditions
- Repeat with careful pipetting of replicates
- Redesign primers to avoid primer dimers
 Observation: highest concentrations overlap
Potential cause: exceeded limit of detection range
Corrective steps:
- Check sample concentrations
- Dilute samples to fall into detection range
 Observation: baseline drift
Potential causes:
- Degradation of the probe
- Bubble in well
- Reduction of azo bonds in BHQ™ quencher
Corrective steps:
- Check baseline without baseline subtraction
- Check behaviour of all dyes in each well (bubbles affect all dyes)
- Remove DTT from the reverse transcription step
- Check sample preparation protocols for reducing agents and ensure these are not carried through
Use the amplification curve to help determine the root cause of problems.
These examples can serve as a starting point for improving your qPCR assay results. Still, they are not a comprehensive guide for every problem that may arise. If you have specific questions regarding unexpected results from your qPCR assay, please reach out to our technical support team at techsupport@biosearch.com.
 |
While most probes will deliver some degree of result for most applications, selecting the best probe for a given application is instrumental to assay optimisation. Find out everything you need to know about selecting the right probe for your assay in this e-book.
|

Related content
Taq Polymerase: What is it and its applications
8 qPCR amplification plot questions answered
Choosing the best qPCR probe chemistry for your assay
